What if I told you that there's a chance that you're approaching content marketing the wrong way?
It's really common.
And at the root of the problem lie assumptions.
You know what they say about assumptions.
When you assume “common knowledge” without testing its veracity, you could very well be missing the mark by a long shot.
“Content is king. Quality over quantity. Long content ranks better.”
It's like a broken record.
We hear this stuff again, and again, and again.
And it's not that any of that common wisdom is wrong, per se. It's more that it's not telling you the whole story.
On its own, those kinds of pithy maxims can't really tell you what you need to know.
The key lies in research. Facts. Hard data.
Have you read between the lines to find out what your audience really wants?
Do you know for sure? Have you tested this stuff?
If not, you should maybe take a step back for a moment.
Try this simple three step process to get a much better handle of what kind of content you should be creating.
Step One: Check Your Assumptions
To start, you gotta check your assumptions.
We all have them.
And research is the best way to prove or bust them.
It’s like what Mark Twain said: “What gets us into trouble is not what we don’t know. It’s what we know for sure that just ain’t so.”
For example, I put two marketing assumptions to the test:
- Content is king. Marketers who spend more time creating content will say their marketing is successful.
- Quality over quantity. Marketers who have higher quality content will say their marketing is successful.
After all, what content marketer worth their salt doesn’t accept a “quality > quantity” mindset?
I certainly did.
But here’s what the data says:
Relevant content is resonant content.
Step Two: Craft Your Questions
[image source: Convince & Convert]
Next, you’ll move the best questions from sheet one onto sheet two, labeled “Survey Questions.”
Remember, your data is only as good as your questions, so clear, concise, and relevant questions are your survey’s lifeblood.
My favorite article on writing survey questions comes from Qualtrics.
They outline the 10 Commandmentsfor killer survey questions. (Definitely worth a read!)
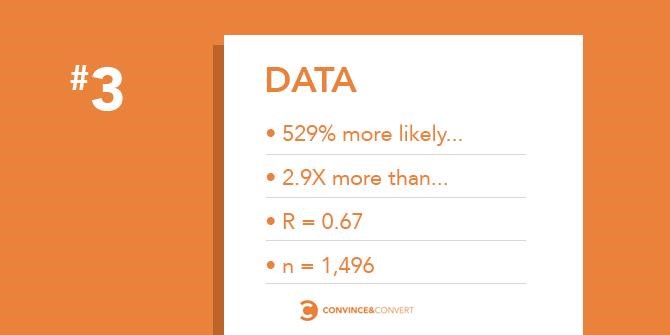
Step Three: Crunch The Numbers
[image source: Convince & Convert]
Now it’s time to get nerdy and run some numbers.
Excel is an easy tool for this.
And if you want some quick visualizations, Tableau is a nice tool as well. (If you wanna go ultra-nerd, you can even learn R or Python.)
If you’re serious and have some big data to crunch, two things you’ll want to do well in Excel is use the CORREL function to get the correlation coefficient.
And the next is to simply use cells to calculate normal distribution probabilities. (Neither of these is as scary as it sounds!)
Your correlation strength is known as an R-value.
It’s measured on a scale from -1 to 1, with 1 being 100 percent correlated, and -1 being 100 percent negatively correlated.
What you’re looking for are patterns that signal whether or not two factors have a chance of impacting the other.
You can get the details in the full article over at Convince & Convert.
CHALLENGE Yourself to Profit!
Free Download: Build Your Profit-Generating Online Business With This Free Blueprint
Sign Up, follow the easy steps and You'll get the tactics, strategies & techniques needed to create your online profit stream. It's free!


