Everyone loves a good infographic.
They're visually appealing and often charming, offering a straightforward visual representation of even the most complex information.
They're a great way to format a step by step guide, present the latest statistics, and more.
But what if there was a way to make the concept of the infographic even better?
More eye-catching, more shareable, and even more informative?
It's time to take things to the next level.
Meet the “gifographic,” the infographic's amped up twin.
Formatted as a .gif image, these creative images introduce an element of looping animation.
Instead of a static image, it moves around — making it all the more likely to catch someone's eye in their Twitter or Facebook feed.
Animation can also be a uniquely useful way to present certain kinds of information, adding an extra educational layer to the graphic and conveying extra shades of meaning.
In a recent blog post, The Content Marketing Institute explains what gifographics are, how to make them, and how you can use them to connect with audiences in just about any industry or niche.
Gifographics
Gifographics are like infographics on steroids. Think about them as animated infographics.
GIF stands for Graphics Interchange Format, originally a file type for both animated and static images that work well on the web.
You can use GIFs on Facebook, Twitter, and Instagram. On Facebook, you cannot upload them natively.
You need to upload them on giphy.com then copy the new URL and paste it in a new Facebook status.
Twitter allows for direct uploads, while Instagram lets you create GIFs using its Boomerang app.
Buffer conducted a study that concluded that posts with featured animated graphics get more social media shares than the ones with no animated visuals. (See more about GIFs in No. 5.)
But what about gifographics? They combine the power of an infographic in a format more likely to be shared by the audience.
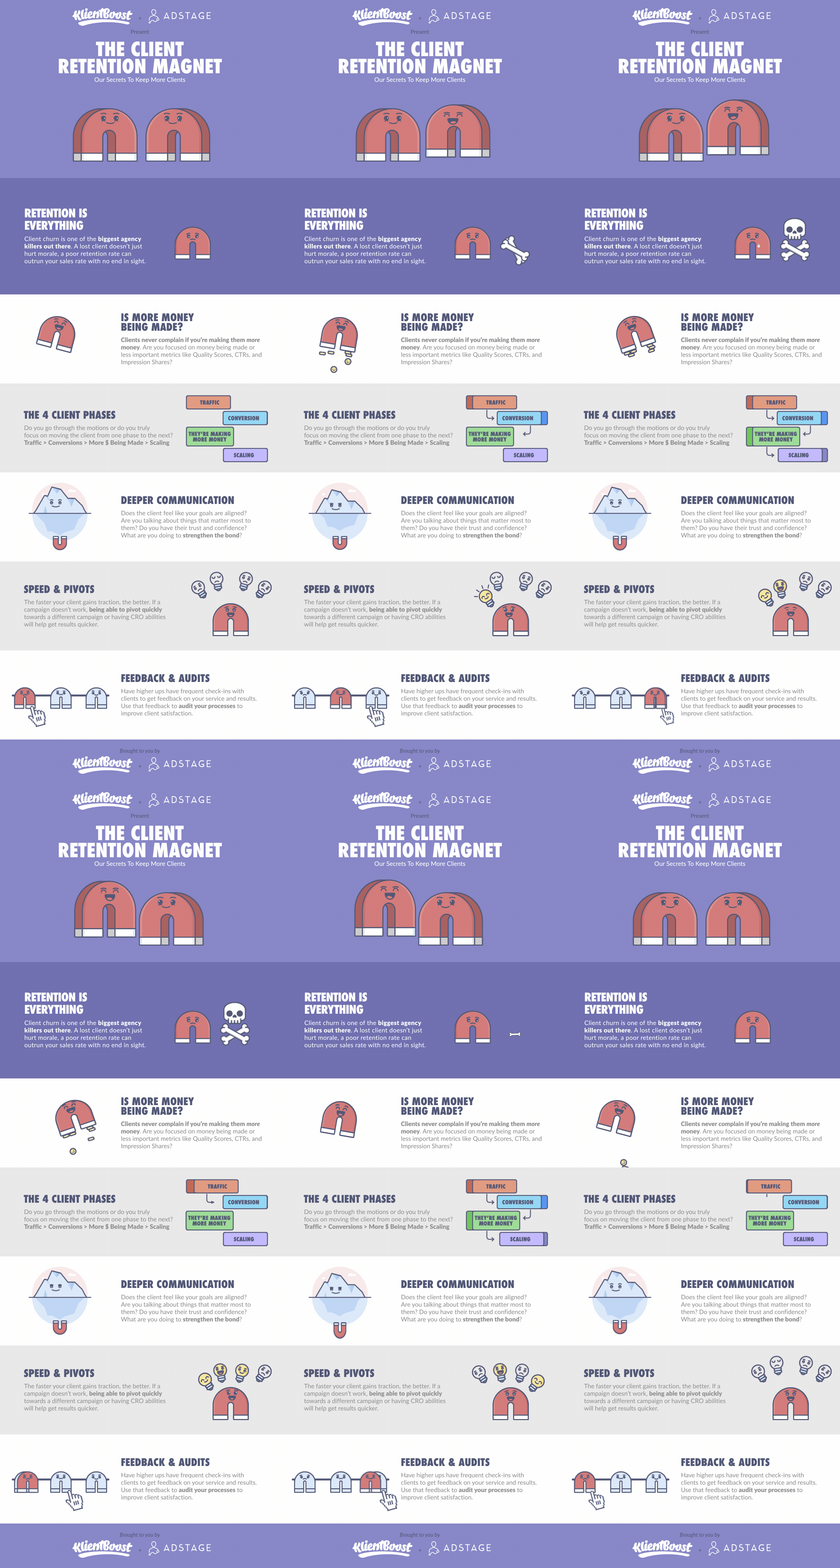
KlientBoost uses a gifographic to show its viewers how to keep client retention high.
It also published the gifographic in a more in-depth article on the blog.
[image source: The Content Marketing Institute]
Takeaway tip: If you know how to explain ideas and data through infographics, take them to the next level and add movement.
It can increase the interest of your audience, better entice them to share the content, and, ultimately, the increased traffic can boost your SEO (and you’ll stand out in SERP results.)
You can find more fresh ideas for great visual content in the full article from The Content Marketing Institute.
CHALLENGE Yourself to Profit!
Free Download: Build Your Profit-Generating Online Business With This Free Blueprint
Sign Up, follow the easy steps and You'll get the tactics, strategies & techniques needed to create your online profit stream. It's free!


